I decided to use a line graph to show the average of fourth grade reading as my first graph. In this graph I used a 210-225 scale to show the differences between the state of West Virginia and the National averages.
I decided to use a line graph to show the average of eighth grade math for my second graph. In this graph I used a 240-300 scale to show the differences between the state of West Virginia and the National averages.
Wednesday, September 9, 2009
Subscribe to:
Post Comments (Atom)
The Three of us
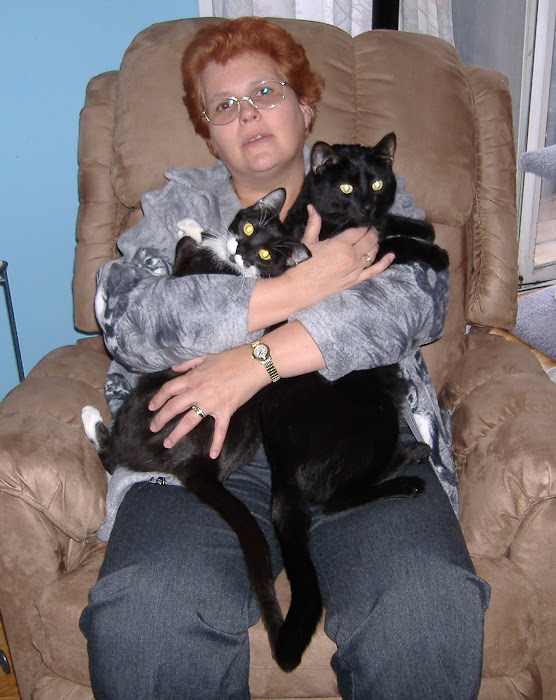
What a hand full!
Meet my kitty

This is Sox
Meet Blackie and Sox

Cats are after all children with fur! (This is a quote from my vets office.)
Me dressed like Sox
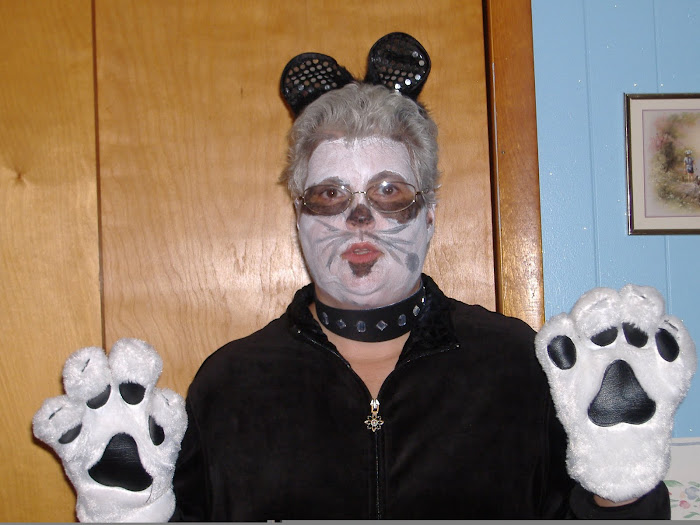
For Preschool Party


No comments:
Post a Comment